
Emory Student-Athletes Use Data Visualization to Highlight Athletic Success
Join us as we speak with Emory University student-athletes Lilah Gery 26BBA, Natalie Price 25BBA, and Isabel Cohen 26BBA about their data visualization project, “Where Does Emory Athletics Stack Up in Their Conference?” In this Q&A, they share insights into their experiences, motivations, and the skills they’ve developed through this endeavor.
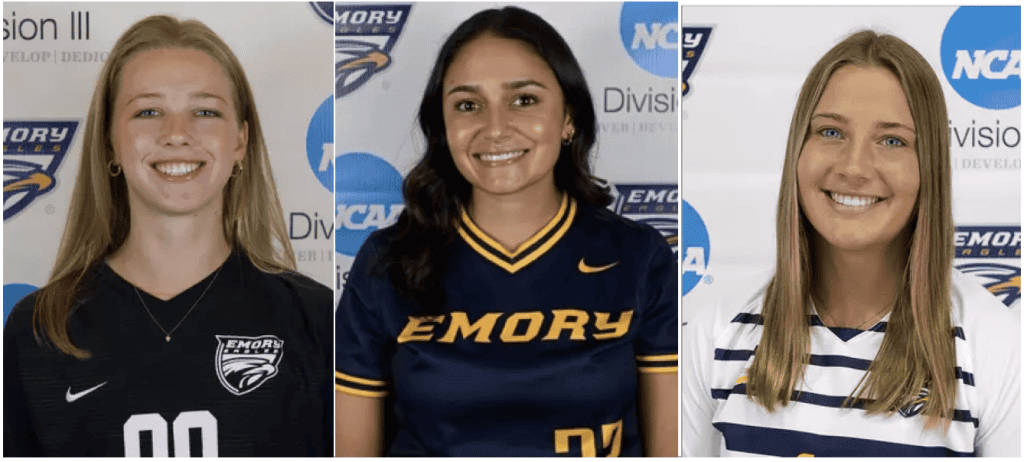
Could you please introduce yourselves and share which sports you play at Emory University?
Lilah Gery: My name is Lilah Gery, and I am a rising senior in the BBA program at Goizueta Business School. I am double concentrating in marketing and ISOM and am interested in working in the sports industry after university. I spent the first two years of my Emory Athletic career on the Women’s Basketball team, then walked onto the Emory Women’s soccer program.
Natalie Price: I am a former member of the Emory Women’s Soccer program.
Isabel Cohen: I am a member of the Softball program.
Can you provide a brief overview of your data visualization project titled, “Where Does Emory Athletics Stack Up in Their Conference?“
This visualization compares Emory Athletics to other schools in the highly competitive University Athletic Association (UAA). It’s designed as a potential recruitment tool for Emory’s athletic department, offering an interactive way to explore each university’s location, overall athletic success, and performance by individual teams.
What motivated you to choose this particular topic for your project?
As three athletes from soccer, softball, and basketball who successfully navigated the recruitment process, we want to help Emory’s athletic department continue attracting top talent. Competing with other academic and athletic powerhouses like NYU, UChicago, and WashU, we saw the need for a tool that could provide recruits with clear, data-driven insights. Our project visualizes how universities in the UAA, Division III’s most competitive conference, have performed across various sports since the year 2000. By offering a historical perspective, we aim to support both the athletic department’s recruiting efforts and help future student-athletes make informed decisions.
Could you explain the data collection process and the types of data you analyzed?
We sourced our data directly from the UAA website, using the comprehensive Record Book & History PDF that details each school’s performance by sport dating back to 1988. We manually reviewed the Record Book and entered the data into an Excel spreadsheet, capturing key variables such as school, year, team conference win percentage, and conference standing. While this manual process was time-consuming, it allowed us to customize the structure of our dataset from the start and eliminated the need for data cleanup later on.
What were some of the key insights or findings from your analysis?
By analyzing our data, we found that WashU has been the most competitive UAA school since 2000, winning 291 conference championships, followed by Emory with 213. Notably, our dataset excludes swim & dive, which would have significantly increased Emory’s total. WashU’s championships are led by Women’s Basketball and Women’s Soccer, while Emory’s are driven primarily by Men’s Tennis. Again, this does not include all sports within these programs, so tapping into all the data would be crucial.
How do you envision your project being utilized by future student-athletes or the university?
We envision our project serving as a powerful recruitment tool to help Emory attract top-tier student-athletes. First, it highlights that Emory competes in the UAA, a conference made up of academically elite schools where every conference game offers a highly competitive and rewarding experience. Additionally, because UAA schools are located across the country, student-athletes have the unique opportunity to travel and compete nationwide. Our visualization also emphasizes that Emory is a powerhouse within this competitive landscape. Looking ahead, we hope to expand the project to include other factors important to recruits beyond athletics, such as academic program strength, school rankings, campus social life (including Greek life), weather, city appeal, and the academic scores typically required for admission. We recognize that the college recruitment process involves more than just athletic success, and we want this tool to showcase why Emory is an exceptional choice both on and off the field.
What challenges did you encounter during the project, and how did you overcome them?
One of the main challenges we faced was deciding how to represent a complex dataset in a way that was simple, approachable, and interactive. We explored several visualization types, including stacked bar charts, spark charts, and bump charts, to capture the different dimensions of our data, such as team, sport, year, standings, and win percentage. Selecting the right visualizations that balanced clarity with depth of information was a key hurdle. We overcame this challenge by applying the design principles we learned in class. We used consistent colors to represent each team (matching their school colors), size to indicate the number of UAA championships in our map visualization, and a white background to emphasize the data. To improve user experience, we also incorporated highlighted actions and dashboard buttons that made the visualizations more interactive and easier to navigate.
How did your experience as student-athletes influence your approach to this project?
Our experience as student-athletes heavily influenced both our approach and work ethic throughout this project. With our demanding schedules, we often had to meet late at night after practices, usually at the Woodpec, to check in on our progress. We continued updating our dataset whenever and wherever we could, whether that meant outside the weight room waiting for another group member’s team lift to end, or in the locker room during any downtime we could find. Being athletes taught us how to stay dedicated and communicate effectively. We trusted each other to complete our respective parts without needing constant oversight or micromanagement.
What are your key takeaways from this project, both academically and personally?
One of our biggest takeaways is how rewarding it is to work on a project that’s both meaningful and personal. Getting to collaborate with close friends on something that directly relates to our experiences as student-athletes made the process even more enjoyable. It was especially fun to take on an open-ended project where we could choose a topic that mattered to us and create something with real potential impact. On a personal level, it felt great to use our skills to give back to the athletic department that has played such a big role in shaping our college experience. Academically, we gained valuable experience in data gathering, visualization design, and working through the challenges of presenting complex information in a clear, user-friendly way.
Do you have plans to expand or build upon this project in the future?
Yes, we have plans to expand this project if there’s interest from the athletic department or even just our individual coaches. We would love to incorporate the additional factors we discussed earlier, such as academic program rankings, social life, weather, and admissions data, to create a more comprehensive tool for recruits. Our goal is to highlight not just Emory’s athletic success but the full student-athlete experience.
What advice would you give to other students interested in combining their passions with academic projects?
Find friends who are just as passionate as you are, because if you do, it won’t feel like work. Working on a project that mattered to us, with people we already loved teaming up with, made even the late nights and extra effort enjoyable. Pick a topic you genuinely care about and surround yourself with teammates who feel the same. It keeps things fun, motivating, and way more rewarding.
Interested in pursuing a business degree? Learn more about the unique programs Goizueta has to offer.